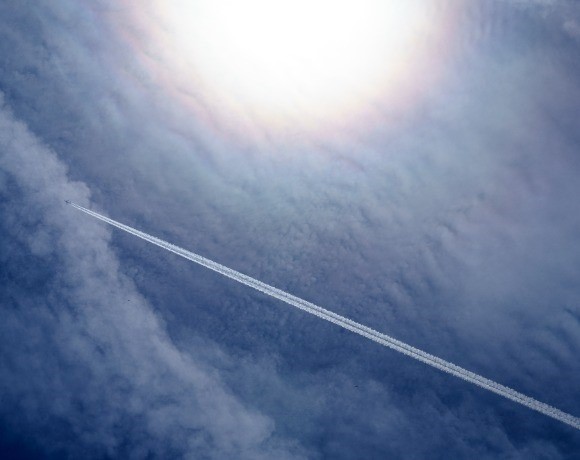
Just as weather patterns shift and evolve, estimates of aviation’s contrail warming impact across an entire year often rely on broad averages. But the picture can be much more precise. By examining two individual flight routes, this case study demonstrates how accurately contrail warming impacts can be identified and quantified at the level of individual assets, airlines or even specific routes.
This second joint report by Nexus Lab, PACE, and Ishka Airfinance compares the contrail-induced and CO2 warming impact of two city pairs: Transatlantic flights between Frankfurt and Boston, and cross-Europe flights between Lisbon and Helsinki. It presents nine key findings and next steps for aviation finance to consider.
But first – the scope
This study examines all scheduled commercial flights between Frankfurt and Boston and Helsinki and Lisbon in 2025. It uses contrails modelled per flight by Nexus Lab with the CoCiP model, ADS-B flight paths, and ECMWF ERA5 weather data. CO2 emissions are modelled by PACE, part of RDC Aviation, and are calculated on great-circle distance. The combination of the two – contrails in CO2e and CO2 – offers a practical view on the individual climate impacts of different routes.
Over 100 years, the warming impact across the 1,867 analysed flights is 1.3x the CO2 from fuel combustion. However, that ratio can change depending on the time of the day, weather, and season. The contrail intensity by airlines in each route also differs, dictated by departure times, but also their seat density.
Finding 1 – Scale
Contrail warming was 1.3× the CO2 warming across both routes during the 2025 calendar year. A CO2-only view would miss more than half of this sample's climate impact.

Finding 2 – Metric
To compare contrails with CO2, their warming is measured over a set time horizon: 20, 50 or 100 years (GWP20, GWP50, GWP100). CO2 keeps warming for centuries, while a contrail's warming is over within hours. The shorter the horizon, the larger contrails look next to CO2. For the same flights, contrail warming is 302 kt CO2e over 100 years and 1,056 kt over 20 years: between 1.3× and 4.5× the CO2. Since 2025, airlines report intra-European flight contrail impacts to the European Commission through the EU ETS’ non-CO2 MRV (e.g. Helsinki-Lisbon). From 2027, all other commercial flights involving an EEA airport will also do so. At this stage, the EU has not yet chosen the time horizon to calculate any eventual contrail avoidance incentive.

Finding 3 - Concentration
Of 1,867 flights, just 149 (8%) caused half of all contrail warming: 161 kt CO2e. The worst 19 flights (1%) alone caused 15%. The bottom 37% of flights added no net contrail warming. This is why avoidance is practical. Airlines do not need to change every flight, only the small number that fly through contrail-forming air, and those can be forecast in advance.

Finding 4 – Timing and direction
For every tonne of CO2 burned flying Lisbon-Helsinki, contrails added 3.5 tonnes of CO2e. On the return leg it was 1.3. The airports and distance are the same, so the difference comes from timing.
Lisbon-Helsinki departs around 16:00 UTC and reaches northern Europe after dark. By day, contrails reflect some sunlight back to space, which partly offsets the heat they trap. At night there is no sunlight to reflect, so each contrail only warms.

Finding 5 – Season
In December, contrails added 2.2 tonnes of CO2e for every tonne of CO2 burned. In August, it was 0.6. Per flight, that is 271t of contrail CO2e in December against 78t in August.
Winter air at cruise altitude is more often cold and humid enough for contrails to form and persist, and longer nights leave less sunlight to offset their warming. A single annual figure hides this swing.

The seasonal swing is much stronger on the European route. On Helsinki-Lisbon, contrails went from 0.7 tonnes of CO2e per tonne of CO2 in August to 6.0 in December, more than eight times higher. On Frankfurt-Boston, they went from 0.6 to 1.5.

Finding 6 – Distance
Short-haul flights are often assumed to matter less for contrails. Across 2025 however, each kilometre flown Lisbon-Helsinki produced slightly more contrail warming than a kilometre flown Frankfurt-Boston, a route almost twice as long.

Finding 7 – Operators
We compared Lufthansa’s and Condor’s scheduled services on Frankfurt-Boston from May to October 2025. Their departures are about two hours apart, so both fly through similar conditions. The airlines fly a different number of flights with different-size aircraft, so totals would not be a fair comparison. Instead, each flight's impact is divided by its seat-kilometres (published seats × great-circle distance), giving grams of CO2e per seat per kilometre.
Per seat, Lufthansa's CO2 is 1.6× Condor's in both directions. That gap is set by the aircraft and stays fixed. The contrail gap is far larger and changes with direction: 8.5× from Frankfurt and 3.4× from Boston. Combined, Lufthansa's total impact per seat is 2.4× and 2.2× Condor's.

Finding 8 – Cost
Under the EU ETS, airlines pay for each tonne of CO2 they emit by surrendering an emissions allowance (EUA). In 2025, an allowance cost €73.45 per tonne ($82.29/t) on average at auction. At that price, the 234 kt of CO2 from these flights costs €17.2m ($19.27m).
Although airlines are reporting contrail impacts through the EU ETS’ non-CO2 MRV, contrails are not priced today. If their 302 kt CO2e were charged at the same rate, they would add €22.2m ($24.87m), taking the bill to €39.4m ($44.14m): 2.3× the CO2-only cost.

Finding 9 – Avoidance
We modelled a conservative scenario: only the 186 flights with the highest contrail impact, the worst 10%, are rerouted. Each flies slightly lower the cold, humid airspace where contrails form, and burns on average 1.25% more fuel to do so. The other 90% fly as they did.
Contrail warming falls from 302 kt to 121 kt CO2e, a 60% cut worth about €13m ($14.57m) at €73.45/t ($82.29/t). The extra fuel adds 0.3 kt of CO2, or 0.16% across all flights. Each extra tonne of CO2 removes roughly 600 tonnes of contrail CO2e.

Conclusion
Contrails don't behave like CO2. CO2 tracks fuel burn in a straight line whereas contrail impact swings dramatically with atmospheric conditions. The same aircraft, on the same route, on the same day, can produce a heavily warming contrail on the outbound leg and almost nothing on the return leg.
This cuts two ways for finance. First, it rules out generic assumptions – no airline, aircraft type or route can fairly be labelled “high-risk”. Second, and more usefully, it means the exposure is concentrated rather than universal. Airlines may not need to overhaul entire operations, they may only need to manage a relatively small number of high-impact flights. This reframes the question about how much of this exposure is manageable, and what does managing it cost? That's a question that financiers and underwriters can now put a number on.
As this case study shows, rerouting just 10% of all flights can reduce contrail warming by 60% with a relatively minor 0.16% fuel penalty across all flights. Not only would contrail avoidance easily pay for itself under a CO₂-equivalent pricing scheme, but it would also deliver emissions reductions at a lower cost than almost any other decarbonisation measure.
For a deeper understanding of why contrails should factor into aviation finance’s risk calculations, see our previous joint report. Want to keep a copy of this case study? Get the PDF version.
Omar Nuruzade is Co-Founder and CEO of Nexus Lab is a contrail reduction software company founded in 2022 with a clear goal - to mitigate the greenhouse effect and promote a more sustainable future.
Rob Neale is Chief Product officer and founder of PACE, part of RDC Aviation, a software and ESG analytics platform focused on aviation CO2 emissions reduction.